
I’ve built a new page for displaying forecasts for carbon intensity in the UK:
https://www.richard-stanton.com/carbon-forecast
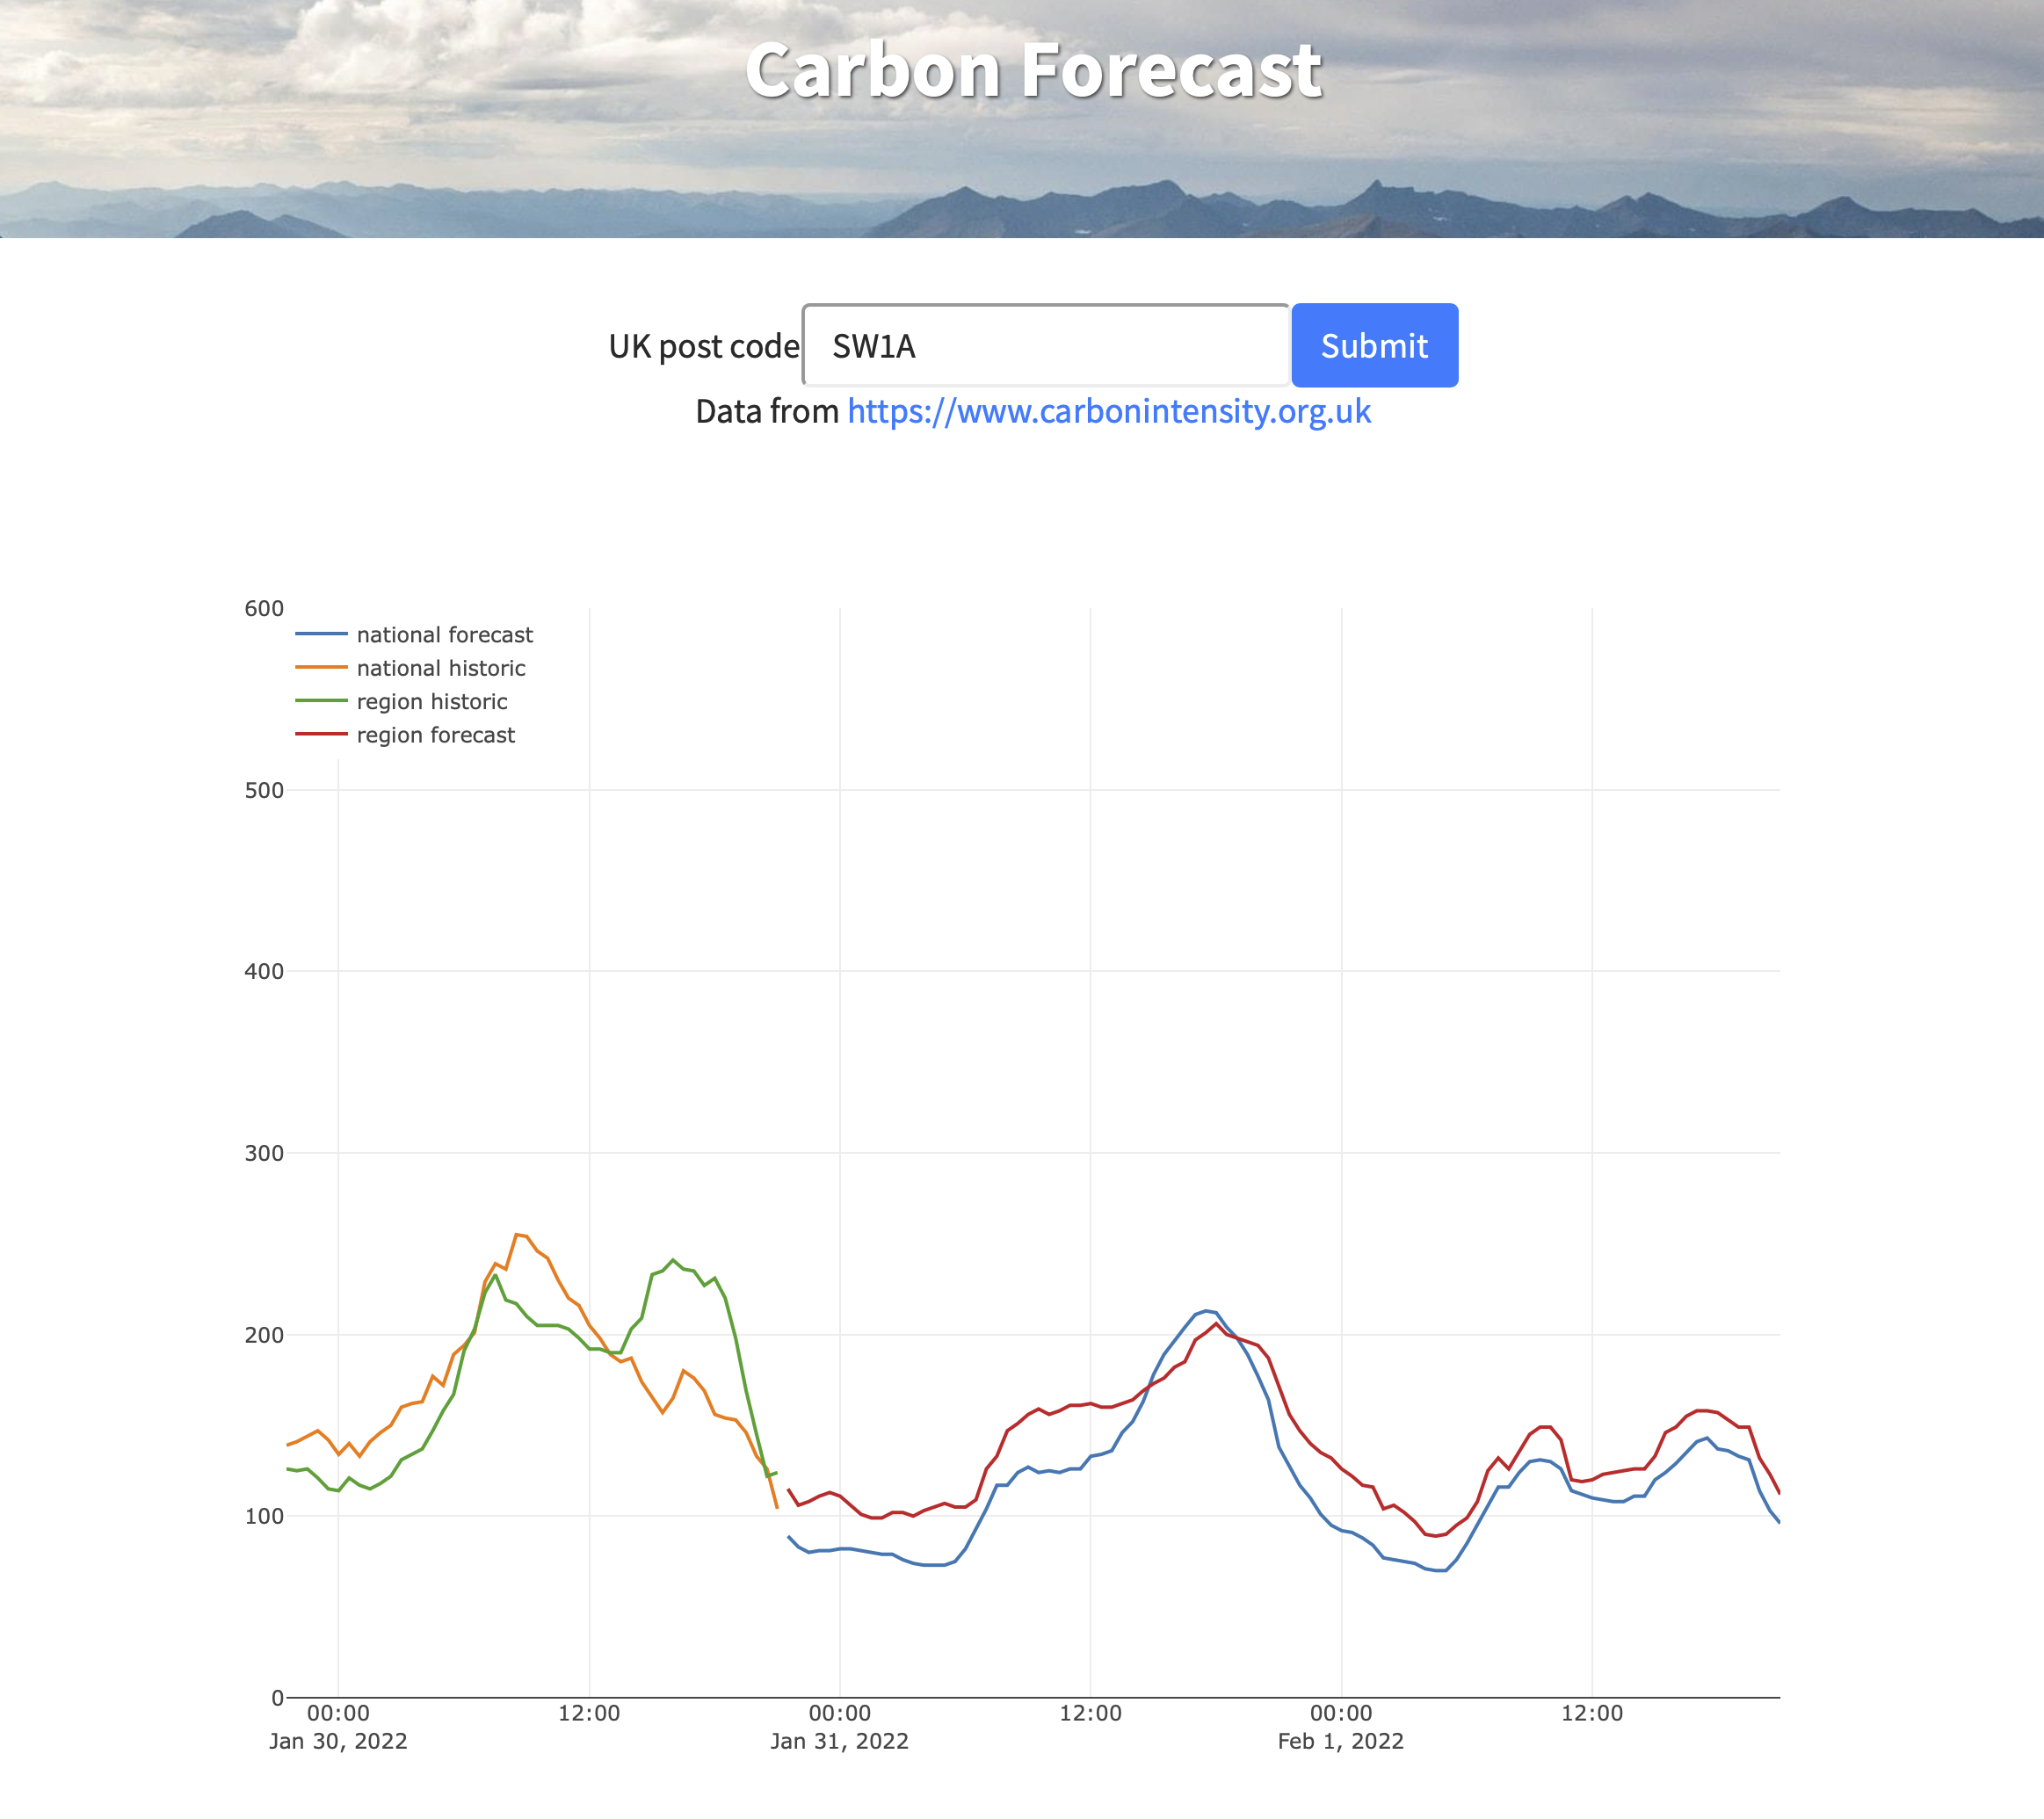
The data comes from the National Grid ESO carbon intensity service - https://www.carbonintensity.org.uk. This displays approximately how much carbon would be produced using 1kWh of electricty at different times in the next couple days.
It’s built in a similar way to the humidity forecast, on javascript and uses jQuery/AJAX to do the requesting of data. The plot is built with plotly.js.
Git available on github.